


What Is Rental Yield and How Is It Calculated?
Rental yield measures the annual return on a property investment as a percentage of its value, providing investors with a standardized way to compare different properties and markets.
Gross Rental Yield Formula
Gross rental yield provides a quick overview of income relative to property price, without factoring in expenses:
Formula: (Annual Rental Income ÷ Property Value) × 100 = Gross Rental Yield %
Example Calculation:
Property purchase price: $200,000
Monthly rent: $1,500
Annual rental income: $1,500 × 12 = $18,000
Gross rental yield: $18,000 ÷ $200,000 × 100 = 9.0%
Net Rental Yield Formula
Net rental yield reveals actual returns after accounting for all property-related expenses—the more accurate profitability measure:
Formula: (Annual Rental Income − Annual Expenses) ÷ Property Value × 100 = Net Rental Yield %
Example Calculation:
Annual rental income: $18,000
Annual expenses (taxes, insurance, maintenance, management, vacancy): $6,000
Net rental income: $18,000 − $6,000 = $12,000
Net rental yield: $12,000 ÷ $200,000 × 100 = 6.0%
Critical Insight: The gap between gross and net yield (typically 2–4 percentage points) represents your operating costs. Minimizing this gap through expense control directly increases profitability.
What Is Considered a Good Rental Yield in 2026?
There’s no universal “good” yield—it depends on location, property type, and investment goals. However, industry benchmarks provide useful guidance:
General Yield Benchmarks:
Below 4%: Low yield; better suited for appreciation plays in high-value markets (San Francisco, New York)
4–5%: Moderate yield; acceptable in stable markets with strong appreciation potential
5–8%: Good yield; solid cash flow with reasonable property values
8–12%: Excellent yield; strong cash flow, typically in affordable markets (Midwest, South)
Above 12%: Exceptional yield; often in distressed or high-risk markets requiring careful due diligence
2026 Market Reality: Most coastal and high-growth metros offer 3–5% yields due to elevated property prices, while Midwest and affordable Southern markets deliver 8–15%+ yields with lower entry costs.
Why Rental Yield Matters for Property Investors
Rental yield directly impacts investment success through multiple channels:
1. Cash Flow and Income Stability
Higher yields generate stronger monthly cash flow, covering mortgage payments, expenses, and profit. For example:
$200,000 property at 5% yield: $10,000 annual income (~$833/month)
$200,000 property at 9% yield: $18,000 annual income (~$1,500/month)
The $8,000 annual difference compounds significantly over a 10-year holding period.
2. Investment Comparison and Decision-Making
Yield provides a standardized metric for comparing properties across different price points and locations. A $100,000 property earning $800/month (9.6% yield) outperforms a $300,000 property earning $1,800/month (7.2% yield) on a cash-flow basis.
3. Portfolio Performance Tracking
Regular yield calculations help investors identify underperforming properties, optimize pricing, and make informed decisions about renovations, refinancing, or sales.
4. Market Opportunity Identification
Yield analysis reveals which markets offer the best risk-adjusted returns, guiding geographic diversification and expansion strategies.
Key Factors That Affect Rental Yield
Multiple variables influence rental yield—understanding these factors helps investors optimize returns.
1. Property Location and Market Dynamics
Location is the primary yield determinant. Affordable markets with strong rental demand deliver the highest yields:
Top-Yield Markets (2026):
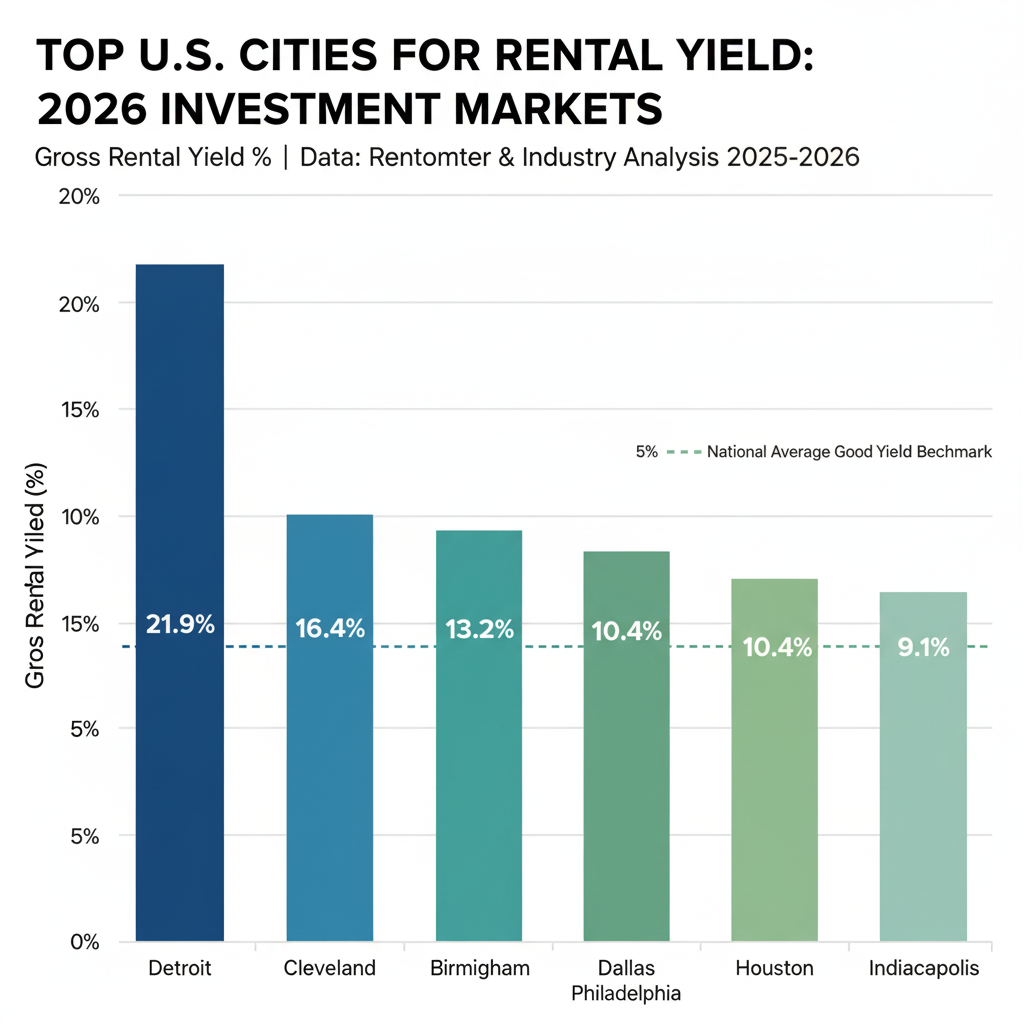
Detroit, MI: 21.9% gross yield ($71,503 avg. home, $1,308 avg. rent)
Cleveland, OH: 16.4% yield ($110,000 avg. home, $1,500 avg. rent)
Toledo, OH: 12.2% yield (extremely affordable homes, stable rents)
Birmingham, AL: 13.6% projected return (low prices, healthcare anchor)
Houston, TX: 9.2% yield (diverse economy, 58% renter population)
Low-Yield Markets (appreciation-focused):
San Jose, CA: 2.59% yield ($1.5M+ avg. home)
Fremont, CA: <3% yield ($1.7M avg. home)
San Francisco, CA: 3–4% yield (high values, moderate rents)
Yield Strategy: Cash-flow investors target Midwest/South markets; appreciation investors accept lower yields in high-growth metros.
2. Property Type and Configuration
Property type significantly impacts achievable yields:
Single-family rentals: Lower yields but longer tenant tenure (3–5 years), lower turnover costs
Small multifamily (2–4 units): Higher yields through multiple income streams, economies of scale
Larger multifamily (5+ units): Highest yields but require professional management
Furnished/short-term rentals: 10–20% higher yields in tourist areas, but higher management intensity
3. Property Condition and Upgrades
Property condition affects both achievable rents and operating expenses:
High-ROI Upgrades Boosting Yield:
Kitchen/bathroom renovations: 10–15% rent increases, 70–100% ROI
Energy-efficient upgrades: Reduce operating costs 20–35%, justify 2–6% rent premiums
Smart home technology: $30–$75/month rent premiums, differentiating from the competition
Modern flooring/lighting: $100–$200/month rent increases
Yield Impact Example:
A $200,000 property earning $1,400/month (8.4% yield), upgraded with a $15,000 kitchen renovation earning $1,600/month, now yields 8.9% on original cost—a 0.5 percentage point improvement worth $2,400 additional annual income.
4. Operating Expenses and Cost Control
Operating expenses directly reduce net yield:
Typical Expense Categories:
Property taxes: 1–3% of property value annually
Insurance: 0.5–1% of property value
Maintenance: 1–2% of property value (or 10–15% of rent)
Property management: 7–12% of rent (if outsourced)
Vacancy allowance: 5–10% of gross rent
Utilities (if landlord-paid): 5–10% of rent
Expense Optimization Strategies:
Preventive maintenance: Reduces emergency repairs, extends asset life
Energy efficiency investments: Lower utility costs 20–35%
Insurance shopping: Annual reviews save 15–30%
Tax appeals: Challenge over-assessments, potentially reduce 10–30%
5. Tenant Quality and Vacancy Rates
Tenant quality directly impacts yield through payment reliability, property care, and turnover frequency:
Bad Tenant Costs Eroding Yield:
Turnover expenses: $1,795–$3,872 per occurrence
Eviction costs: $3,500–$10,000
Property damage: $1,000–$5,000 beyond normal wear
Vacancy during legal proceedings: $2,000–$8,000 lost rent
Prevention Through Screening:
SmartScreen’s comprehensive tenant screening, which combines credit (TransUnion ResidentScore® predicts eviction 16% better than generic scores), criminal background, eviction history, employment verification, and rental references, prevents 60–80% of problematic tenants.
Screening ROI:
A $35–$75 screening investment that prevents $8,295–$26,872 in bad-tenant losses delivers 110:1-764:1 ROI—directly protecting and enhancing rental yield.
6. Rental Pricing Strategy
Rental pricing balances income maximization with occupancy maintenance:
Underpricing Risks:
Leaving money on the table monthly
Attracting lower-quality tenants
Signaling property issues to the market
Overpricing Risks:
Extended vacancies ($65–$90 daily cost on a $2,000/month unit)
Attracting desperate or unreliable tenants
Higher marketing costs
Optimal Pricing Approach:
Research comparable properties within a 0.5-mile radius
Adjust for condition, amenities, and unique features
Set rent at 95–100% of the market for quality units
Review pricing quarterly, adjust annually with market data
How to Maximize Rental Yield: 8 Proven Strategies
Strategy 1: Select High-Yield Markets Strategically
Location selection is the most impactful yield decision:
High-Yield Market Characteristics:
Affordable property prices (low denominator in yield equation)
Strong rental demand (employment anchors, universities, healthcare)
Low vacancy rates (below 6% preferred)
Stable or growing population
Limited new construction (supply/demand balance)
2026 High-Yield Opportunities:
Midwest: Detroit (21.9%), Cleveland (16.4%), Toledo (12.2%), Indianapolis (9.1%)
South: Birmingham (13.6%), Houston (9.2%), Dallas (10.4%)
Texas border cities: Laredo (10.7%), Corpus Christi (10.8%), Brownsville (12.1%)
Research Process:
Use rental yield calculators and market data to compare opportunities across markets before committing capital.
Strategy 2: Optimize Rental Pricing with Market Data
Set competitive rates that maximize income while maintaining occupancy:
Pricing Optimization Process:
Research comparables: Identify 5–10 similar properties within a 0.5-mile radius
Adjust for differences: Condition, amenities, parking, utilities included
Analyze seasonal patterns: Peak demand periods (spring/summer) support higher rates
Test market response: If unit rents within 7 days, price may be too low; if vacant 30+ days, reconsider pricing
Annual Rent Review Framework:
Excellent tenants: 2–3% increase (below market, retention-focused)
Average tenants: 3–4% increase (aligned with inflation)
Post-improvement: 5–10% increase (justified by added value)
Critical Insight: Data-driven, moderate adjustments are more likely to be accepted and less likely to drive away good tenants. Predictable annual adjustments are smoother than infrequent large jumps.
Strategy 3: Implement Comprehensive Tenant Screening
Quality tenants protect and enhance yield through reliable payments, property care, and longer tenure:
SmartScreen Screening Components:
Credit Analysis: TransUnion ResidentScore® predicts eviction 16% better than generic credit scores, payment history, and debt-to-income ratio
Criminal Background: Nationwide search across 370+ million records
Eviction History: Court filings identifying 3x higher future default risk
Employment Verification: Income confirmation ensuring a 2.5–3x rent-to-income ratio
Rental History: Previous landlord references detect issues in 60–80% of concerning cases
Yield Protection Math:
Screening cost: $35–$75
Bad tenant loss prevented: $8,295–$26,872
Yield impact: A single eviction on a $200,000 property earning $18,000 annually reduces net yield by 3–4 percentage points for that year
Strategy 4: Reduce Operating Expenses Systematically
Lower expenses directly increase net yield:
Energy Efficiency (20–35% utility reduction, 1–2 year payback):
LED lighting throughout: $300–$800 investment
Smart thermostats: $150–$300 each, 15–25% HVAC savings
Low-flow fixtures: $100–$300, 20% water savings
Improved insulation: $1,000–$3,000, long-term savings
Preventive Maintenance (50–70% emergency repair reduction):
Schedule six-month property inspections
Service HVAC systems annually
Address small issues before they escalate
Insurance Optimization (15–30% savings):
Shop multiple carriers annually
Bundle properties for discounts
Increase deductibles appropriately
Install security systems for premium discounts
Expense Reduction Yield Impact:
Reducing annual expenses by $1,200 on a $200,000 property increases net yield by 0.6 percentage points—a meaningful improvement compounding over your holding period.
Strategy 5: Strategic Property Improvements
High-ROI upgrades justify rent increases that boost yield:
Top 2026 Improvements by ROI:
Energy Efficiency (100–200% ROI):
Smart thermostats, LED lighting, and efficient appliances reduce costs while justifying 3–5% rent premiums.
Kitchen Updates (70–100% ROI):
Modern cabinets, countertops, and appliances justify $100–$300/month increases depending on the market.
Bathroom Renovations (70–90% ROI):
Updated vanities, fixtures, tile, and lighting appeal to quality tenants.
Smart Home Technology (80–120% ROI):
Keyless entry, security cameras, and smart thermostats differentiate properties and justify $30–$75/month premiums.
Premium Finishes (60–80% ROI):
Quality flooring, modern lighting, and fresh paint improve marketability and reduce vacancy duration.
Improvement ROI Calculation:
Kitchen upgrade cost: $12,000
Monthly rent increase: $200
Annual additional income: $2,400
Payback period: 5 years
Ongoing yield boost: 1.2 percentage points on a $200,000 property
Strategy 6: Minimize Vacancy Through Retention
Every vacant day costs yield. At $2,000/month rent, each empty day loses $66:
Retention Strategies (70–80% renewal rates):
Early outreach: Contact tenants 90–120 days before expiration
Renewal incentives: Modest improvements, minor rent discounts for multi-year commitment
Responsive maintenance: 24-hour acknowledgment, prompt resolution
Professional communication: Respectful, clear, consistent
Small gestures: Holiday cards, anniversary recognition, periodic upgrades
Fast Turnover Strategies (7–14 days between tenants):
Pre-market 30 days before move-out
Professional photography increases inquiry rates by 40–60%
Multi-platform listing (Zillow, Apartments.com, Facebook Marketplace)
SmartScreen’s 24–48 hour screening enables fast approvals
Move-in-ready condition before tenant exit
Vacancy Reduction Yield Impact:
Reducing vacancy from 30 days (8.2% vacancy rate) to 14 days (3.8%) on a $2,000/month property recovers $1,056 annually—a 0.5 percentage point yield improvement on a $200,000 property.
Strategy 7: Consider Alternative Rental Strategies
Alternative approaches can significantly boost yields in appropriate markets:
Furnished Rentals:
Furnished units command 20–50% premiums over unfurnished, particularly in markets with corporate relocations, medical rotations, or temporary work assignments.
Short-Term Rentals (Airbnb/VRBO):
Can generate 50–100% higher income than long-term leases in tourist destinations, but require more intensive management and higher operating costs.
Rent-by-Room (House Hacking):
Renting individual rooms in larger properties can increase gross income 30–50% compared to whole-unit leasing, though it requires more management.
Medium-Term Rentals (30–90 days):
Target traveling professionals, insurance relocations, and extended stays—combining higher rates with more stability than nightly rentals.
Caution: Alternative strategies increase management complexity and may be subject to regulatory restrictions. Research local laws before implementing.
Strategy 8: Leverage Tax Strategies
Strategic tax planning increases after-tax yield:
Standard Rental Deductions:
Mortgage interest
Property taxes
Insurance premiums
Maintenance and repairs
Property management fees
Utilities (landlord-paid)
Advertising and screening costs
Depreciation (27.5 years residential)
Advanced Strategies:
Cost segregation: Accelerate depreciation on components with shorter lives
Bonus depreciation: Immediate deduction for qualifying improvements
1031 exchanges: Defer capital gains when upgrading properties
QBI deduction: Up to 20% deduction on qualified rental income
Tax Planning Yield Impact:
A $15,000 annual NOI property showing only $500 taxable income after $14,500 depreciation pays minimal taxes versus $2,100–$3,300 without tax planning—increasing after-tax yield by 0.8–1.7 percentage points.
Risks and Challenges of Rental Yield Maximization
Risk 1: Overpricing Leading to Extended Vacancies
Aggressive pricing can backfire, creating costly vacancies that destroy yield:
Warning Signs:
Property vacant 30+ days with no quality applications
High inquiry volume but no showings
Multiple showing rejections citing price
Mitigation:
Use market data to set competitive rates. Accept slightly below maximum rent to maintain occupancy and reduce vacancy risk.
Risk 2: Deferred Maintenance Creating Larger Problems
Neglecting maintenance to reduce expenses backfires long-term:
Consequences:
Small issues escalate into expensive emergencies
Property condition deteriorates, reducing achievable rents
Tenant satisfaction drops, increasing turnover
Safety issues create liability exposure
Mitigation:
Implement preventive maintenance programs. Budget 1–2% of property value annually for maintenance regardless of short-term cost pressures.
Risk 3: High-Yield Markets with Hidden Risks
Markets offering exceptional yields often carry elevated risks:
Common High-Yield Market Risks:
Economic concentration: Single-industry towns are vulnerable to layoffs
Population decline: Shrinking tenant pool, reduced demand
Property condition issues: Older housing stock requiring more maintenance
Higher vacancy rates: Supply/demand imbalances
Property management challenges: Finding quality local management
Mitigation:
Research market fundamentals thoroughly. Diversify across multiple markets and property types to reduce concentration risk.
Risk 4: Poor Tenant Selection Destroying Returns
Inadequate screening leads to payment problems, property damage, and costly evictions that devastate yield:
Bad Tenant Impact:
A single eviction costing $10,000 on a $200,000 property earning $18,000 annually reduces that year’s net yield from 6% to roughly 1%
Mitigation:
Comprehensive SmartScreen tenant screening prevents 60–80% of problematic tenants. Never compromise screening standards to fill vacancies quickly—the cost of one bad tenant far exceeds the cost of an extended vacancy.
Risk 5: Legal and Tax Complications
Rental properties involve complex regulations affecting profitability:
Compliance Areas:
Fair Housing Act requirements
FCRA rules for tenant screening
Local landlord-tenant laws
Tax reporting and documentation
Safety and habitability standards
Mitigation:
Use compliant screening services (e.g., SmartScreen), maintain detailed records, consult qualified tax and legal professionals, and stay up to date on regulatory changes.
Balancing Rental Yield and Property Appreciation
Successful investors balance yield (income today) with appreciation (value growth over time):
Yield-Focused Strategy:
Markets: Midwest, affordable South (Detroit, Cleveland, Birmingham)
Goal: Maximize monthly cash flow
Trade-off: Lower appreciation potential
Best for: Income-focused investors, retirees, cash flow reinvestment
Appreciation-Focused Strategy:
Markets: Coastal metros, high-growth areas (San Francisco, Austin, Miami)
Goal: Maximize long-term property value growth
Trade-off: Lower current yields (3–5%)
Best for: Longer time horizons, wealth building, tax-advantaged appreciation
Balanced Strategy:
Markets: Secondary cities with growth potential and reasonable yields (Indianapolis, Columbus, Phoenix suburbs)
Goal: Solid cash flow PLUS appreciation
Trade-off: Neither maximum yield nor maximum appreciation
Best for: Most investors seeking diversified returns
Portfolio Approach:
Sophisticated investors hold properties across the yield/appreciation spectrum, combining high-yield properties for income with appreciation plays for wealth building.
TL;DR: Rental Yield Maximization Checklist
Calculate yield accurately: Use net yield (after expenses) for true profitability assessment
Target good yield benchmarks: 5–8% generally good; 8–12% excellent; 12%+ requires due diligence
Select high-yield markets: Midwest/South offer 9–22% yields vs. 3–5% coastal
Screen tenants comprehensively: SmartScreen prevents $8,295–$26,872 losses protecting yield
Optimize rental pricing: Research comps, adjust for features, review annually
Control operating expenses: Target 40–45% expense ratio through efficiency measures
Implement strategic improvements: Focus on 70–100% ROI upgrades (kitchens, energy efficiency, smart home)
Minimize vacancy: Retention programs (70–80% renewal), fast turnovers (7–14 days)
Leverage tax strategies: Depreciation, deductions, 1031 exchanges increase after-tax yield
Balance yield and appreciation: Diversify portfolio across yield-focused and growth markets
FAQs: Rental Yield Maximization
What is a good rental yield in 2026?
A good rental yield typically ranges 5–8% gross or 4–6% net, though this varies by market. Midwest markets like Detroit (21.9%), Cleveland (16.4%), and Toledo (12.2%) offer exceptional yields due to low property prices and strong rental demand. Coastal markets (San Francisco, New York) typically yield 3–5% but offer higher appreciation potential. Cash-flow investors target 8%+ gross yields, while appreciation-focused investors accept 4–5% in high-growth markets.
How do I calculate rental yield on my property?
Calculate gross rental yield by dividing annual rental income by property value, then multiplying by 100. For example: ($18,000 annual rent ÷ $200,000 property value) × 100 = 9% gross yield. Calculate net rental yield by subtracting annual expenses before dividing: (($18,000 − $6,000 expenses) ÷ $200,000) × 100 = 6% net yield. Net yield is more accurate for comparing investment performance.
What’s the best way to quickly increase rental yield?
The fastest yield improvements come from: (1) Optimizing rental pricing through market research to ensure you’re not undercharging; (2) Reducing vacancy through retention programs and fast turnovers; (3) Comprehensive tenant screening via SmartScreen preventing costly bad tenants; (4) Expense reduction through energy efficiency, insurance shopping, and preventive maintenance; (5) Strategic improvements (smart home, kitchens) justifying 10–15% rent increases.
Should I prioritize rental yield or property appreciation?
It depends on your investment goals and timeline. Yield-focused investors (income-oriented, shorter time horizons, reinvestment strategies) should target Midwest/South markets with 8–15%+ yields. Appreciation-focused investors (wealth building, longer horizons, tax advantages) may accept 3–5% yields in high-growth coastal markets. Most investors benefit from a balanced approach combining cash-flow properties with appreciation plays across diverse markets.
How does tenant quality affect rental yield?
Tenant quality dramatically impacts yield. Bad tenants cause $8,295–$26,872 total losses through unpaid rent, property damage, eviction costs, and extended vacancies. A single eviction on a property earning $18,000 annually can reduce that year’s net yield by 3–4 percentage points. Comprehensive screening through SmartScreen prevents 60–80% of problematic tenants, protecting yield with $35–$75 investments delivering 110:1 to 764:1 ROI.
What are the highest-yield rental markets in 2026?
Top U.S. markets for rental yield in 2026 include: Detroit, MI (21.9%), Cleveland, OH (16.4%), Toledo, OH (12.2%), Birmingham, AL (13.6%), Houston, TX (9.2%), Dallas, TX (10.4%), Philadelphia, PA (10.4%), and Indianapolis, IN (9.1%). These markets combine affordable property prices with strong rental demand, creating favorable yield equations. However, high-yield markets may carry additional risks (economic concentration, property condition issues) requiring thorough due diligence.
Conclusion
Rental yield maximization requires property investors to strategically optimize multiple variables—from initial market and property selection targeting 8–12%+ yields in affordable, high-demand markets like Detroit (21.9%), Cleveland (16.4%), and Houston (9.2%), through comprehensive SmartScreen tenant screening protecting yield by preventing $8,295–$26,872 bad tenant losses, to ongoing expense control achieving 40–45% operating expense ratios through energy efficiency investments delivering 20–35% utility reductions, preventive maintenance programs, and annual insurance reviews saving 15–30%, while simultaneously implementing strategic property improvements generating 70–100% ROI with 10–15% rent premiums (kitchens, smart home technology, energy upgrades), minimizing vacancy through retention programs achieving 70–80% renewal rates and fast turnovers of 7–14 days, and leveraging tax strategies including depreciation and 1031 exchanges that increase after-tax returns by 0.8–1.7 percentage points. By understanding the gross and net yield formulas, benchmarking against 5–8% good yield and 8–12% excellent yield standards, balancing yield-focused and appreciation-focused properties across diversified portfolios, and consistently applying data-driven decision-making to pricing, expenses, improvements, and tenant selection, property investors can achieve sustainable, long-term returns that outperform average performers by 3–5 percentage points annually—representing $6,000–$10,000 additional income per $200,000 property compounding to significant wealth differences over holding periods of 10–20+ years.
Professional Resources: